All the time when something is broken on my network (e.g. network outage, system down, traffic slow), tcpdump is my "goto" tool for investigation of the root problem. But the question is: where do I run it? A typical home network setup looks something like this:

There are a couple of choke points (a.k.a. single points of failure). And my OpenWRT router is one of those. The perfect place to make sure I'm capturing all the traffic!
tcpdump is available on OpenWRT. There are 2 packages: tcpdump and tcpdump-mini. Save space by installing tcpdump-mini (only has a few protocol parsers built-in to save space).
opkg update
opkg install tcpdump-mini
tcpdump -i eth0.1 -ne
On OpenWRT, I typically use the following parameters to tcpdump:
-n: don't do name lookups of hosts or port numbers (I don't want to accidentally generate more traffic when troubleshooting)-e: show the ethernet header (source and destination MAC addresses, 802.1q VLAN headers). It's the VLAN headers that are really helpful because sometimes the router's built-in switch adds the header in places where you may not expect.
It's also possible to use tcpdump to capture traffic to view on another computer with other tools (like Wireshark). The captured PCAP files either need to be very small to fit in the /tmp ramdisk (a few MB big at most), or mount a USB storage device. Then just add the -w parameter with a filename:
tcpdump -i eth0.1 -ne -w /mnt/my_pcap_file.pcap
To see the VLAN headers on the internal switch, just use interface eth0 in the examples above instead of eth0.1 (in conjunction with the -e parameter).
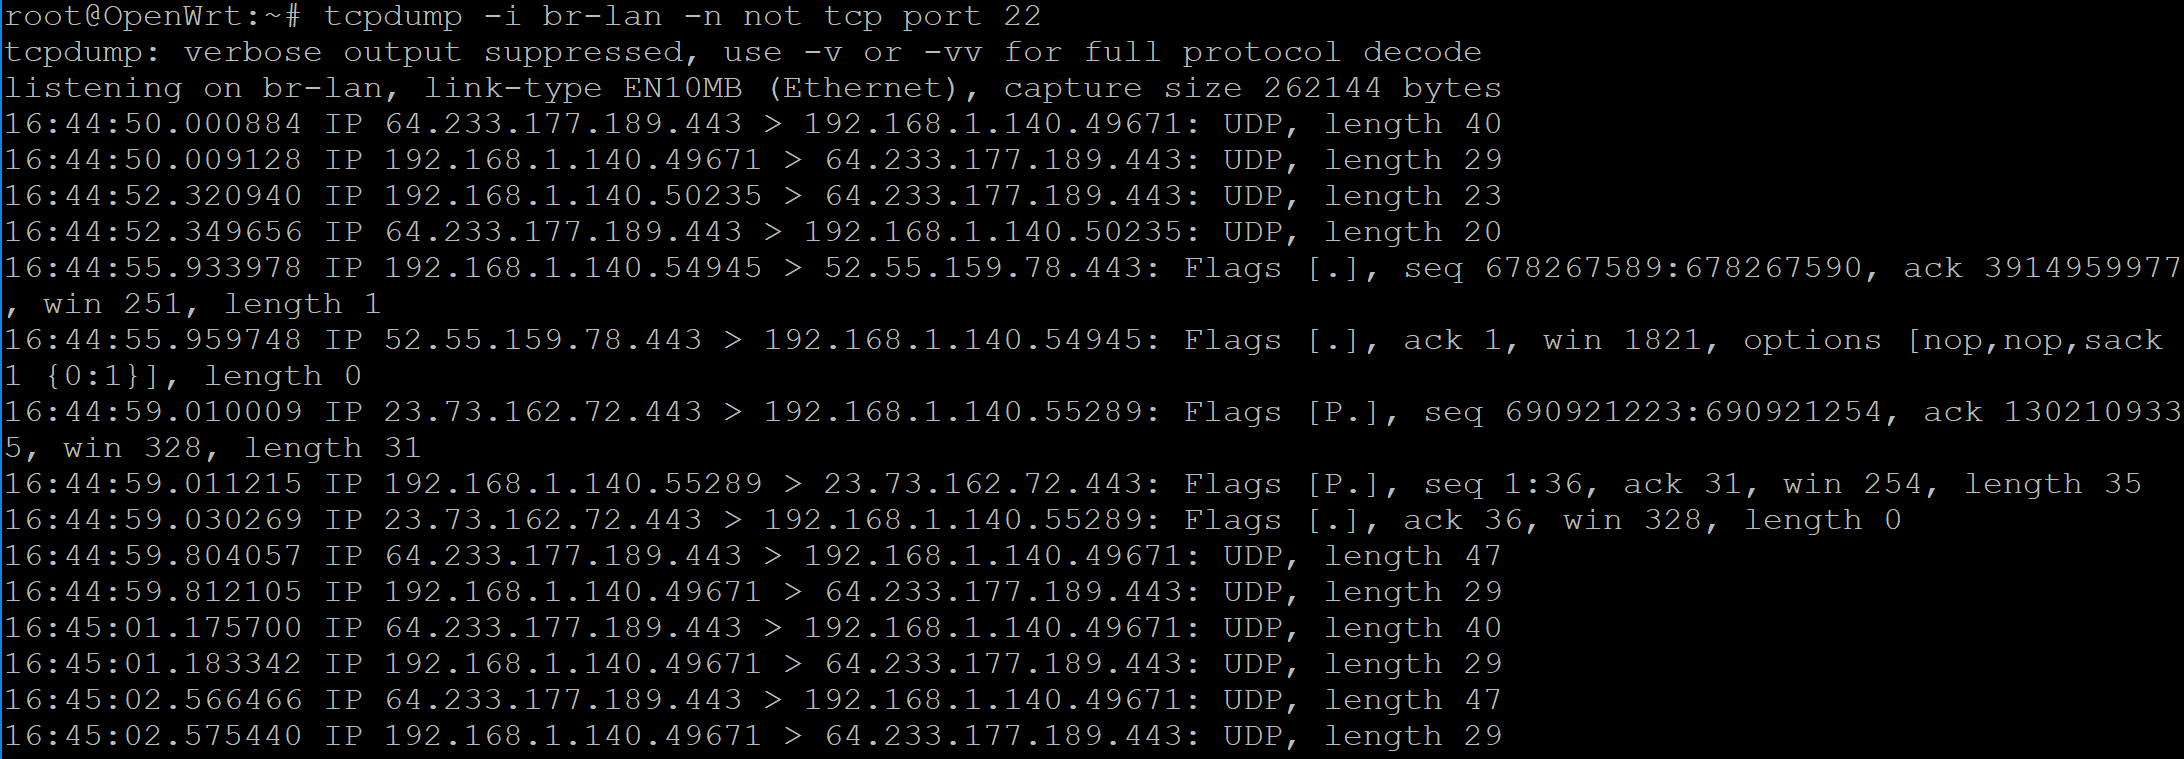
Here's an example session (it appears that one of my desktop PCs is using Google's new QUIC Protocol on UDP port 443.